Step by step
Open the Dashboard
It's first in Shopify's menu. At the top, the period: Today, 7, 30 or 90 days, and Updated with ⟳ to read the numbers again. The whole page counts the same period: the tiles, the chart and its total.
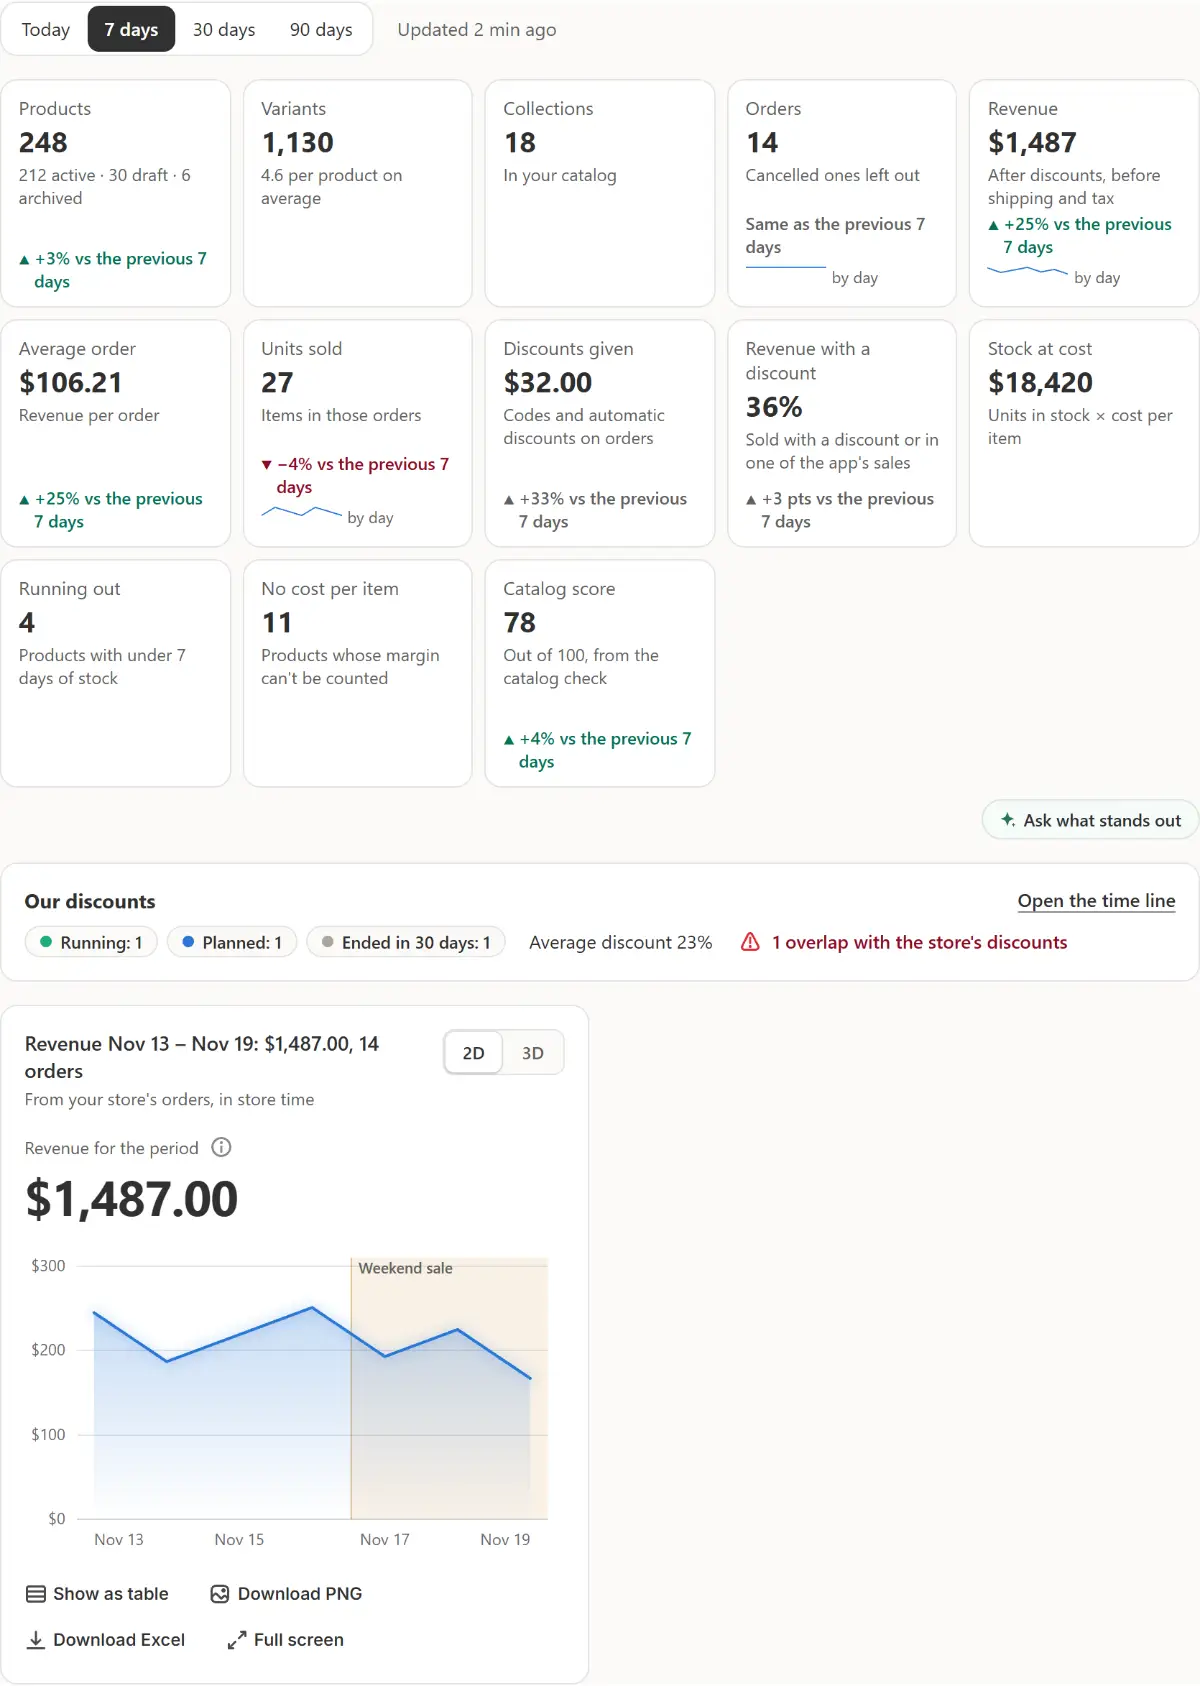
The app's real screen, with example store data. Read the tiles
Products, Variants, Collections, Orders, Revenue (after discounts, before shipping and tax), Average order, Units sold, Discounts given, Revenue with a discount, Stock at cost, Running out, No cost per item and Catalog score. Each shows ▲ or ▼ against the same period before where that comparison is fair. A tile opens its tab.
Ask what stands out
Under the tiles, Ask what stands out asks the chat on the right about these numbers at once: what stands out, and what to do about it.
Check Our discounts
Always the first widget: how many of the app's sales and cart deals are Running, Planned and Ended in 30 days, the average discount, and in red how many meet a discount of the store's own. Open the time line opens Discounts → Overview.
Read the widgets
What's running now with Pause and Open, Revenue by day (the chat's chart card, for the page's period), Running out soon, Last sale with Results, Catalog check and Every section with its live numbers.
Customize widgets
Customize widgets is beside the period: Hide, Show and the arrows move a widget; Our discounts always stays first. Each change saves at once for the whole store and is in History with Undo.
Choose where it opens
Settings → Dashboard: Opens on sets the period the page opens on, and Back to default puts every widget back.

Tips
- Shopify gives the app the last 60 days of orders, so over 90 days the orders' tiles count those 60 days and say so, with nothing to compare.
- With Today picked, each change is against yesterday.
- Revenue by day has 2D and 3D, Show as table, Download PNG, Download Excel and Full screen, as in the chat.
What to check
- The tiles and the chart count the period picked at the top.
- Our discounts counts the sales you expect to be running and planned.
Common mistakes
- Looking for profit on the Dashboard: it isn't shown there, because without every product's cost it would be a guess. Analytics → Results shows it for each sale.
- Reading a missing tile as zero: what the app can't read is left out, and one line says why when orders can't be read.
Your questions
Why is Stock at cost missing?
It shows only when your products have a cost per item. No cost per item counts the products without one.
Who sees my widget layout?
Everyone who opens the app in your store: the layout is saved for the whole store, and each change is in History with Undo.
Related tutorials
- Start, Dashboard and the menuRead Market Manager's Start: tiles for the main jobs, one field and what's running now. Then the Dashboard's numbers and every section of the menu.
- Read sale resultsRead a sale's units, revenue and orders against the days before it, see its extra profit, compare sales in Results and share a sale report.
- Charts in the AI chatAsk the chat for a chart of your sales, orders, stock or a product's price. Switch 2D and 3D, show it as a table, and download it as a PNG or Excel file.
Learn more
- Use caseDid Your Shopify Sale Make Money? See Each Sale's ResultsSee what each Shopify sale earned, and before it starts, how much more you need to sell to earn the same at a discount, from your products' cost.
- FeatureOrders and reportsAsk the chat how a week went, what sells best or what runs out soon. The answers come from your own orders and stock, as a chart or a table you can download.
Run your next sale with Market Manager
Free plan. Paid plans start with a 7-day free trial.