Step by step
Ask for a chart
In the chat on the right of any page, ask in your own words, for example “Draw a chart of my sales for the month”, “a chart of stock” or “when do customers buy most?”. The app draws the chart itself from your orders, stock, price history and sales; AI only picks what to show and says what it shows, the conclusion first.
Know what it can draw
Sales, orders or units by day or week, stock by product, a product's price over time, a sale before, during and after, best sellers, revenue by collection, and orders by weekday and hour.
Read the card
The title says the result in words. Under it, the total in big figures with ▲ or ▼ against the period before, then the line or bars, with your sales as soft bands on the time axis. Hover over or touch a point for its value.
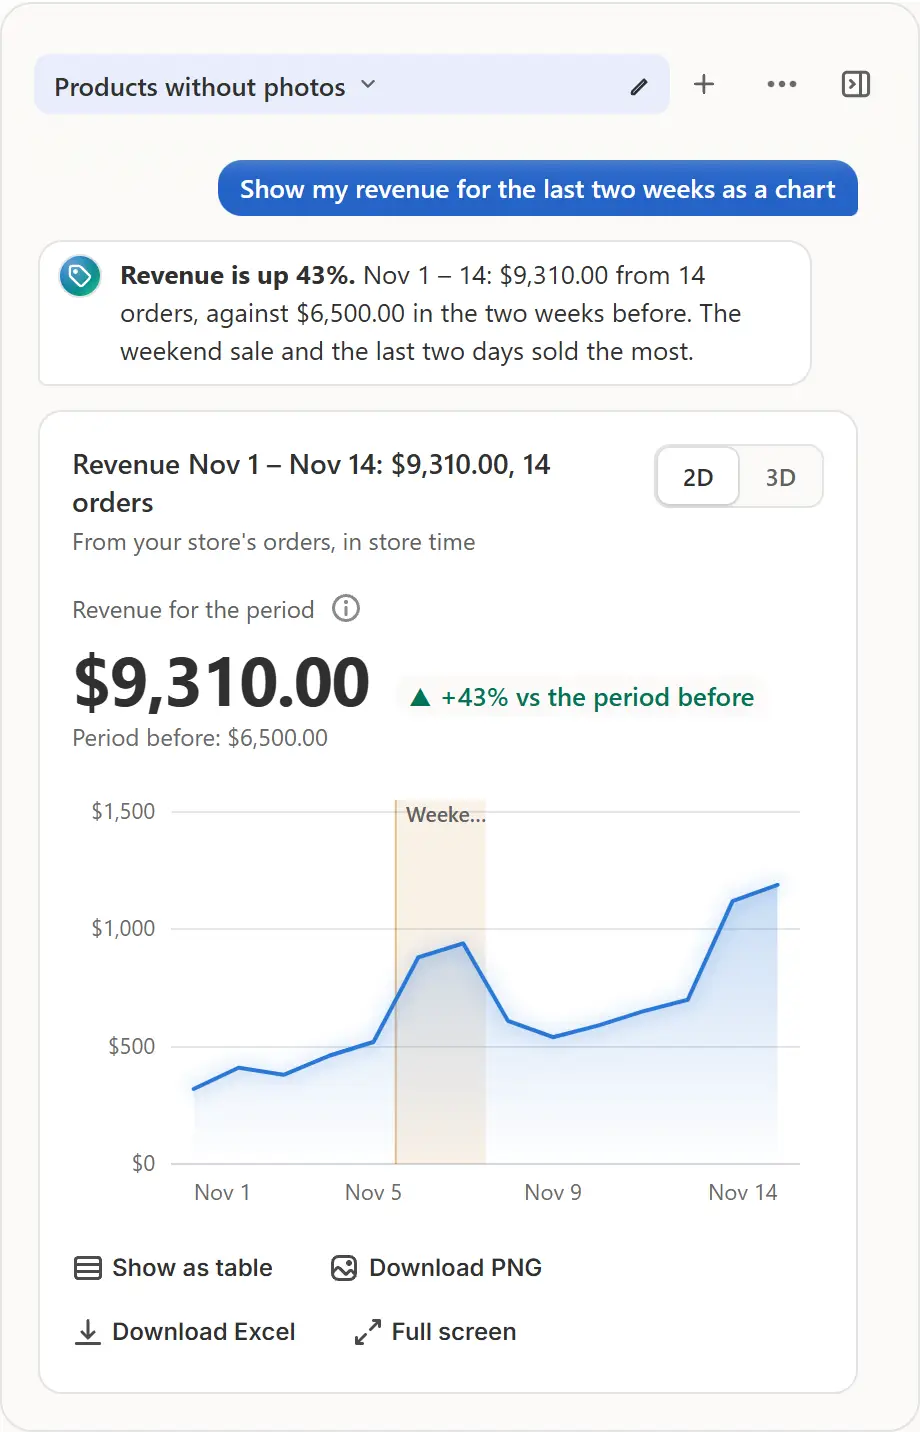
The app's real screen, with example store data. Change the period
7 days, 30 days and 60 days switch the period of a sales, orders, best sellers, collections or weekday chart. Ask without naming a period and the chart starts at the last 7 days; while they have no order it takes 30, then 60 days, and says so in a line.
Turn it in 3D
2D / 3D beside the title draws the same numbers in 3D: columns standing on a floor, a line as a ribbon, the weekday × hour map as a relief. Drag to turn it, scroll or pinch to zoom, double-click to go back. Ask for a chart in 3D and the card opens in 3D; 2D keeps the exact numbers.
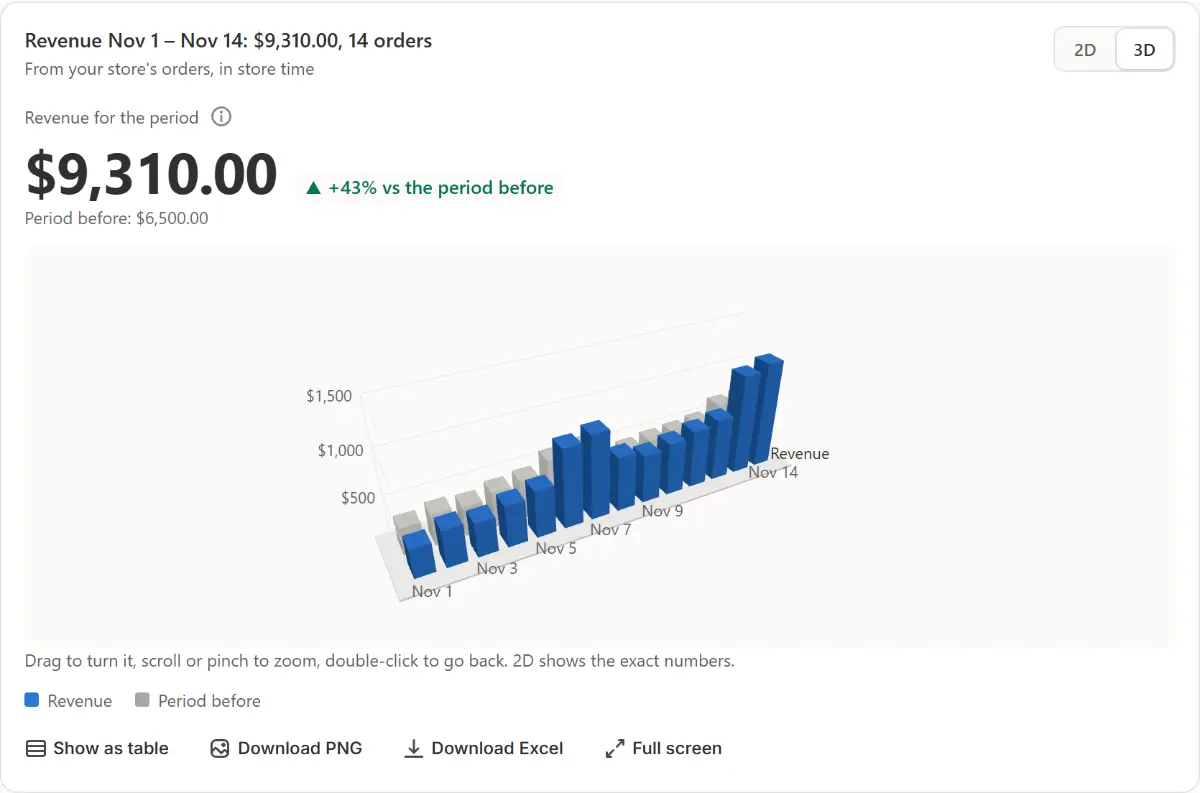
The app's real screen, with example store data. Keep it
Show as table gives the same numbers as rows, Download PNG saves a picture, Download Excel saves the rows and Full screen opens the chart in a big window. The chart stays in the conversation and is drawn again after a reload.


Tips
- Ask to compare last week with the week before, and the card shows exactly those two weeks, the earlier one beside the later.
- Ask for a table or a list, such as “best sellers as a table”, and the card opens as its table, with the chart one press away.
- A short follow-up, such as “and last month?”, draws the same chart again with only that changed.
- The Dashboard's Revenue by day is the same card, for the period the page shows.
What to check
- The title and the total are for the period you asked for.
- Period before shows a number, or says the app has no data that far back.
Common mistakes
- Expecting more than 60 days of orders: Shopify gives the app the last 60 days, so a period before past that shows no data, never zero.
- Reading exact values off the 3D view: switch to 2D, or press Show as table.
- Looking for 3D on a device without 3D graphics: there is no 3D button, and a chart asked for in 3D is drawn flat with a line that says so.
The plan you need
On the Free planEvery plan. The message that asks for a chart counts as one AI request: 20 a month on Free, 200 on Pro and 1,000 on Business. The period buttons on the card don't.
Your questions
Does a chart see my customers?
No. Charts read your orders' dates, products and amounts from the last 60 days, never your customers' data.
Why does my chart show zeros?
A period with no order is a real zero: the title says No orders and the dates, and the card says when the last order was, with Show 60 days.
Related tutorials
- Deep calculationsAsk the chat what's bought together, for a forecast or a report in Excel: it works it out exactly in Python on your store's data, with a chart and files.
- The DashboardRead your store's numbers for today, 7, 30 or 90 days, each against the period before, see Our discounts and the revenue chart, and arrange the widgets.
- Conversations and files in the chatKeep each topic in its own conversation tab: rename, pin, close and find it again. Attach a photo, PDF, CSV or Excel file, and know what the app keeps.
Learn more
- Use caseDid Your Shopify Sale Make Money? See Each Sale's ResultsSee what each Shopify sale earned, and before it starts, how much more you need to sell to earn the same at a discount, from your products' cost.
- FeatureOrders and reportsAsk the chat how a week went, what sells best or what runs out soon. The answers come from your own orders and stock, as a chart or a table you can download.
Run your next sale with Market Manager
Free plan. Paid plans start with a 7-day free trial.